Cost analysis tools by CostPerform
Go from good to great with CostPerform's cost analysis tools
There is no such thing as a free lunch, or in other words, every company and organization has to deal with costs. So what every business tries to do, is to keep costs as low as possible compared to their revenues. And the only way to do that properly is through regularly making cost analysis with the help of the right cost analysis tools.
What is cost analysis
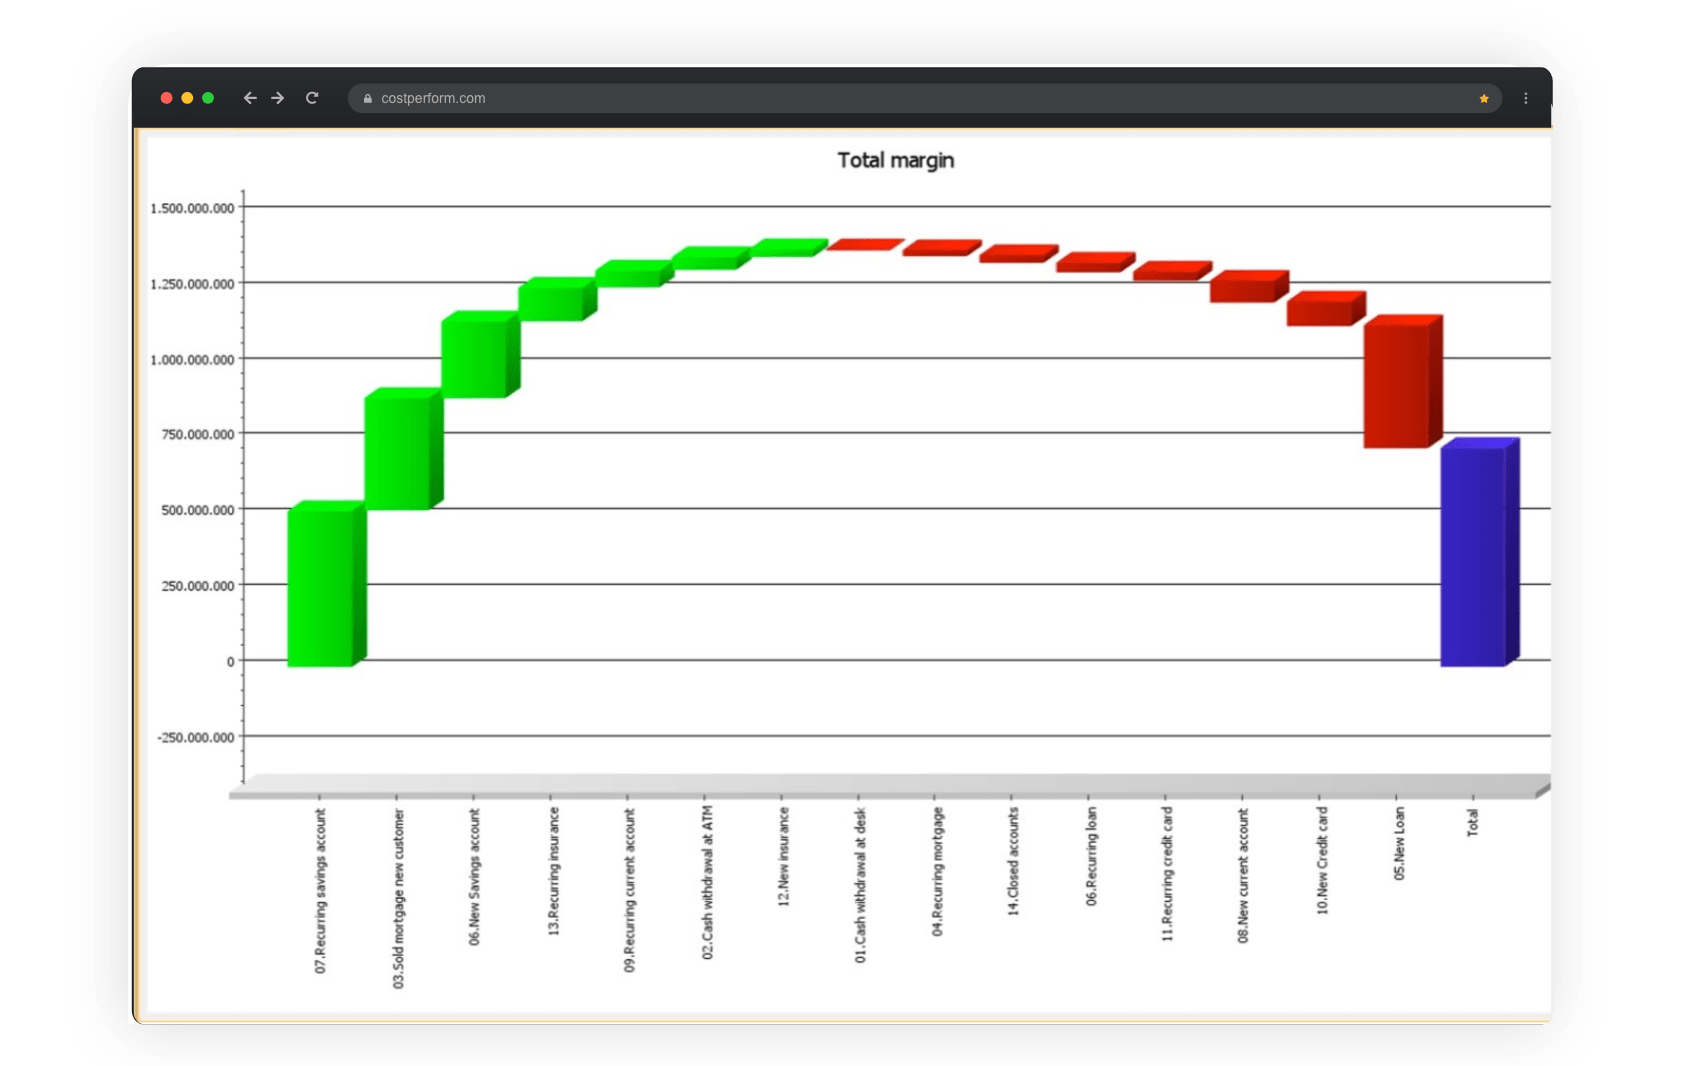
Cost analysis is the science in which you try to determine where your costs are flowing to, where your costs are coming from, and what the drivers are that influence your costs. Although cost analysis can be complicated, starting off is actually quite simple. We advise beginning with a so-called whale chart as shown below. Charts like these can be easily made with our cost analysis tools.
Feeders and bleeders
A whale chart shows you your profit by Product, Customer or Channel, depending on what you’ve chosen. The chart starts on the left side with your most profitable products (feeders) shown as green bars and ends with your least profitable products (bleeders), the red bars. The blue bar represents the combined total profit of your company or organization, so if you want to improve your profit, you have to analyze your bleeders with cost analysis.
Note: while the whale chart above is an oversimplified example with only 14 products, CostPerform has made similar charts with over 10.000 products, customers and channels. It all comes down to understanding where to start your cost analysis and which cost analysis software to use.
The next step in cost analysis
Roll up
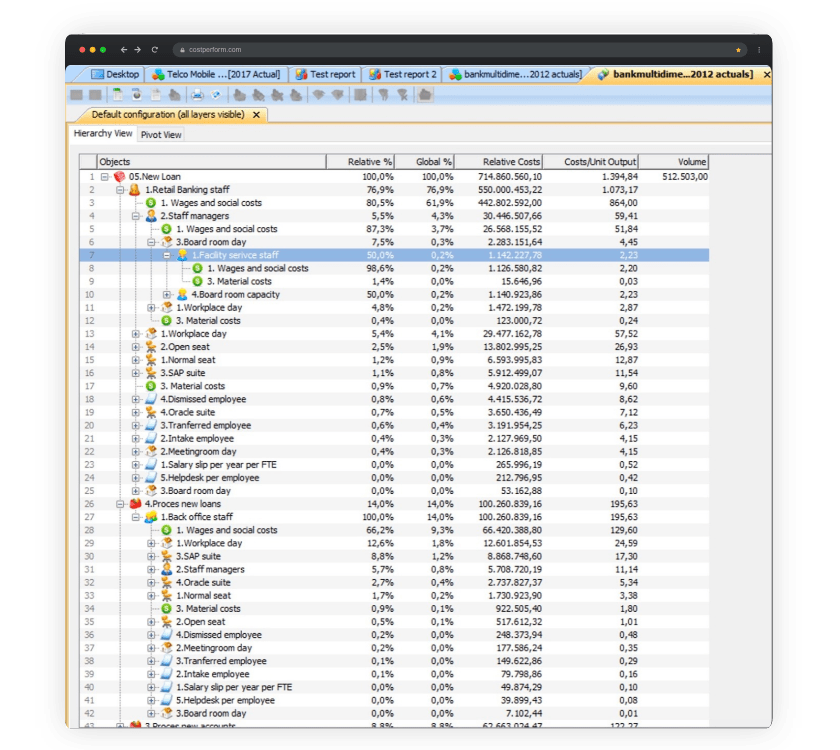
In the roll-up above, you can see that about 77% of the costs of a new loan is incurred through retail banking staff (row 2). Processing loans in the back-office (row 26) is the second-largest cost item with over a 100 million in costs. In the example above we can also see that the costs of retail banking staff are comprised mainly of wages and social costs (row 5, 80,5%), and that staff managers (row 4, 5,5%) and workplace (row 13, 5,4) battle for the second position. From here on, the cost analysis can continue, in this case with CostPerform’s drill down cost analysis tool.
Drill down
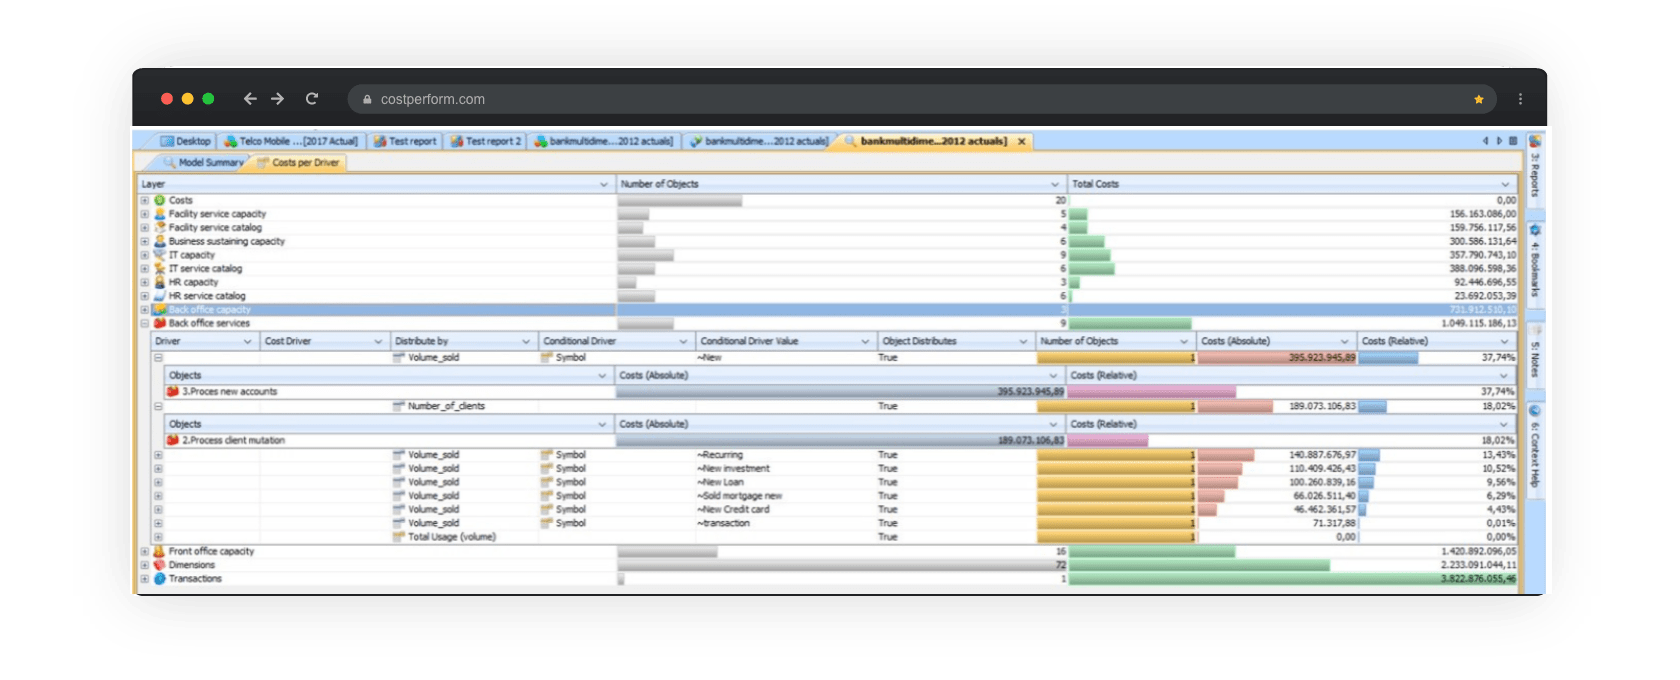
On the basis of this overview, you have to check whether the breakdown makes sense. In this case by asking yourself if it’s logical that most of the time and costs are spent on back-office. And what about the products? Etcetera, etcetera. But knowing where the costs end up doesn’t automatically tell you what the cost drivers are in your cost model. In every part and aspect of your cost model, CostPerform can tell you what the most important drivers are. In the example below, you see a cost analysis of the total costs of the back-office broken down by cost driver. As you can see, the volume of the new client accounts and the number of client mutations determine 55% of costs. This means that any process improvement here creates huge benefits.
Note: Roll-up and Drill-down are two of CostPerform’s many unique cost analysis tools.
The conclusion on cost analysis
Cost analysis is vital for any company or organization that wants to keep its costs as low as possible and outperform the competition. As illustrated by the examples above, CostPerform offers a number of cost analysis tools to simply make detailed cost analysis and gain the insights needed to better deal with costs. For any questions about cost analysis or cost analysis tools, please contact us.


